Vivado 2018.2 much slower than 2017.2
Detecting the problem (2018-08-26)
I see much longer elapsed times for Vivado 2018.2 compared to 2017.2 on a
Linux system.
I use Ubuntu 2016.04 LTS, thus a system supported for Vivado.
I have cross checked on a Debian Wheezy system, with very
compatible trends.
It's most pronounced for small designs, the elapsed time shown in the GUI is
             2017.2    2018.2
    synth_1    0:51      1:31
    impl_1     1:04      2:57
so both synthesis step, as well as implementation, are much slower in 2018.2
than they are in 2017.2.
Usually, I use a fully scripted implementation flow. The elapsed times for a somewhat larger design, but still small by today's standards, for synthesis only, synthesis and implementation, and full synthesis+implementation+bitgen are
                      2017.2    2018.2
    synth            1m08.6s   2m16.6s
    synth+impl       3m10.6s   6m56.1s
    synth+impl+bit   3m50.1s   9m16.1s
From this, it's clear that all three steps are substantially slower.
When looking at a CPU monitor (like good old xosview) one
immediately sees that for 2018.2 runs Vivado uses a lot of system state time.
In certain phases, which last for half a minute, one sees 75% system time.
This is not observed for 2017.2.
Needless to say that tests were done on an otherwise idle machine, and that
no significant paging was visible.
I used pidstat to trace user and system state time and got for
full synth+impl+bit runs
  very small design
    2017.1: usr:   136.07   sys:     6.36   tot:   142.43
    2018.2: usr:   180.85   sys:   190.21   tot:   371.06

  small design
    2017.1: usr:   492.83   sys:    19.99   tot:   512.82
    2018.2: usr:   853.77   sys:   224.00   tot:  1077.77
It is clearly visible that usr time slightly increases,
and sys time explodes by more than an order of magnitude.
Last but not least I checked in which phases Vivado 2018.2 behaves differently that Vivado 2017.2
  --- synth step ---
    INFO: [Device 21-403] Loading part xc7a100tcsg324-1
      --> 75-80% system time

  --- impl step ---
    INFO: [Device 21-403] Loading part xc7a100tcsg324-1
      --> 75-80% system time

    Starting Cache Timing Information Task
      --> 55-80% system time

    report writing
    INFO: [Device 21-403] Loading part xc7a100tcsg324-1
      --> 75-80% system time
    INFO: [Timing 38-478] Restoring timing data from binary archive.
      --> 75-80% system time

  --- bitgen ---
    INFO: [Device 21-403] Loading part xc7a100tcsg324-1
      --> 75-80% system time
    INFO: [Timing 38-478] Restoring timing data from binary archive.
      --> 75-80% system time
    INFO: [IP_Flow 19-2313] Loaded Vivado IP repository 'Vivado/2018.2/data/ip'.
      --> is simply idle for quite some time
From all the above the bottom line is:
- it seems that a very inefficient I/O library is used
- it seems that Vivado waits for something when loading the IP repository
The effects I've seen are quite drastic, and reproducible on two Linux systems (one being a supported Ubuntu 2016.04 LTS).
Refining the problem description (2018-09-01)
I've done a little bit more research on this issue. I've tested two designs
  snhumaio     ~190 LUT;    ~160 Flops;    ~1% slice of 7a35 (Basys3)
  w11a        ~5700 LUT;   ~2400 Flops;   ~20% slice of 7a35 (Basys3)
so one 'null-design' and one small design, both for a Digilent Basys3 board on two systems
sys1: Ubuntu 16.04 LTS; dual-coresys2: Debian 7; XEON quad-core with hyper-threading
                 --  snhumanio --    -----  w11a -----
                    sys1     sys2       sys1      sys2

      2016.4     3m44.2s  2m34.2s    8m00.0s   5m00.5s
      2017.1     3m28.5s  2m19.6s    8m00.6s   4m50.9s
      2017.2     3m43.6s     n/a     8m35.9s      n/a
      2017.3        n/a   6m12.1s       n/a    9m09.1s
      2017.4     9m36.5s  7m17.7s   15m14.7s  10m10.1s
      2018.1     9m30.4s  7m47.8s   14m08.9s  10m20.5s
      2018.2     8m55.2s  7m19.3s   13m47.6s  10m01.8s
The snhumanio essentially measures general setup overhead, because there is
little to compile or route.
From this is apparent that
- the main performance drop came with the 2017.2 to 2017.3 transition
- a second smaller drop came with 2017.4
- while 2018.2 brought a mild improvement
xosview,
shows for 2018.2
- often extended periods of 75% system time
- some times extended idle times
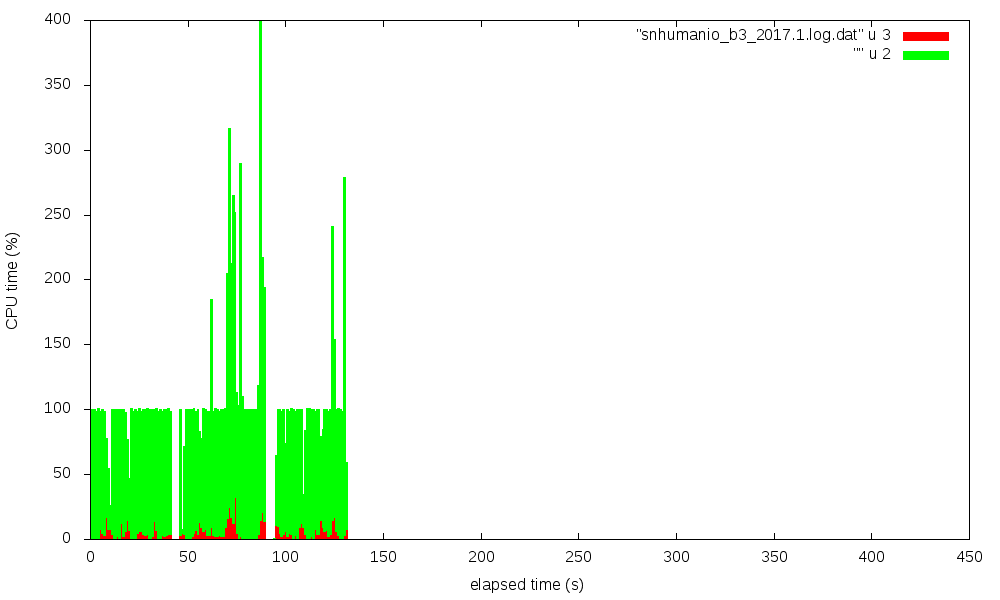
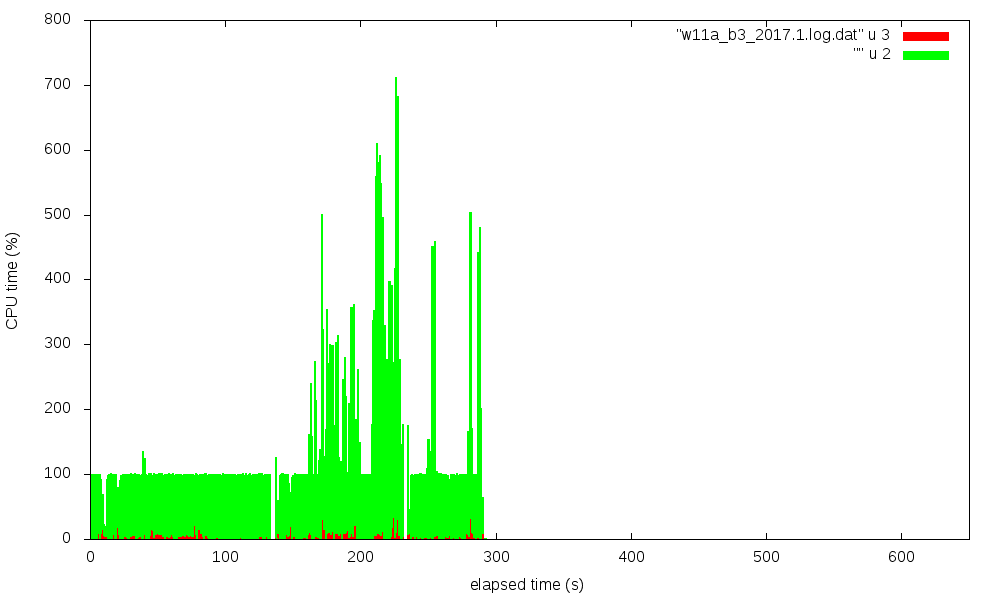
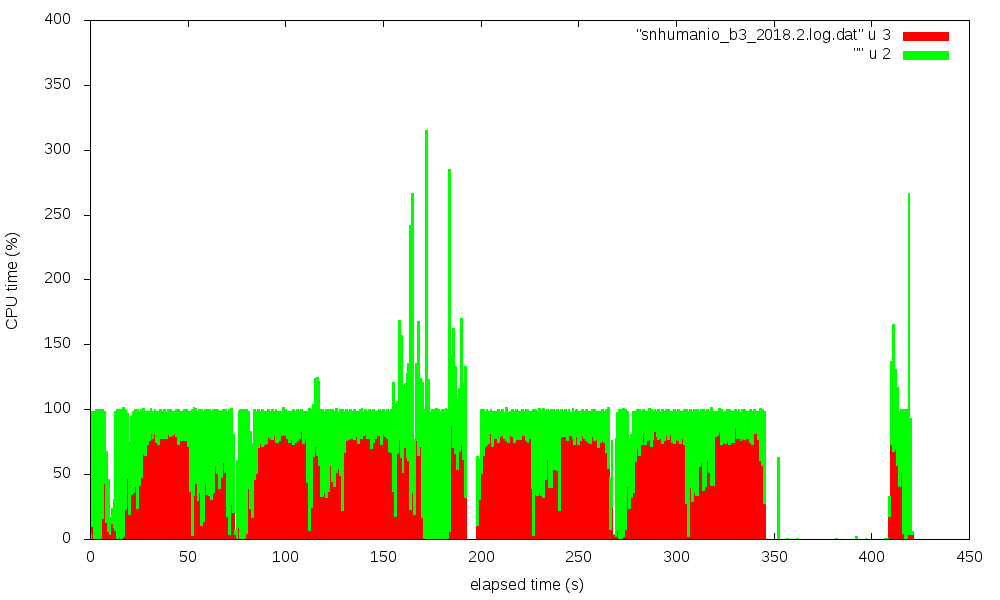
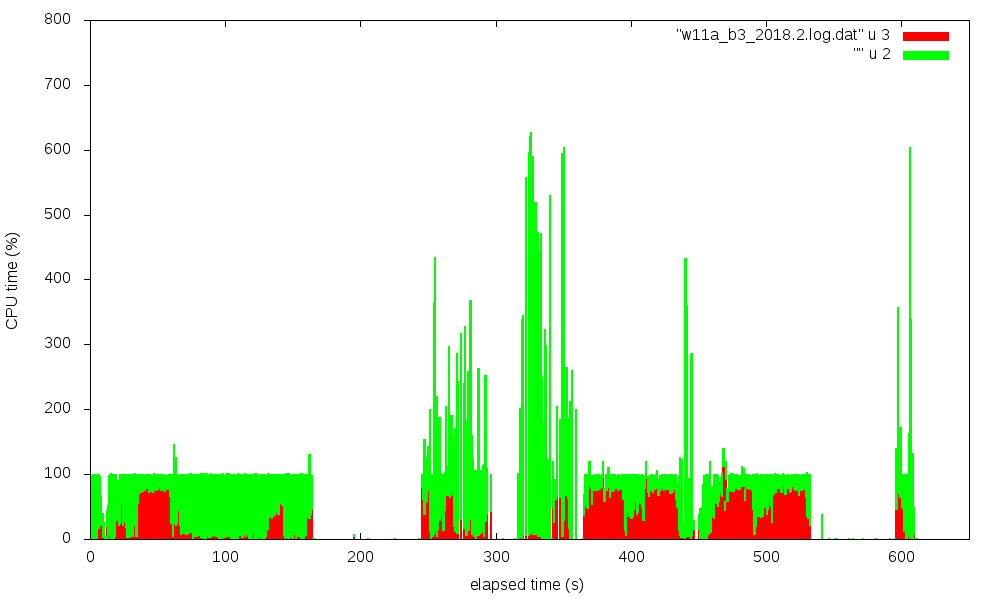
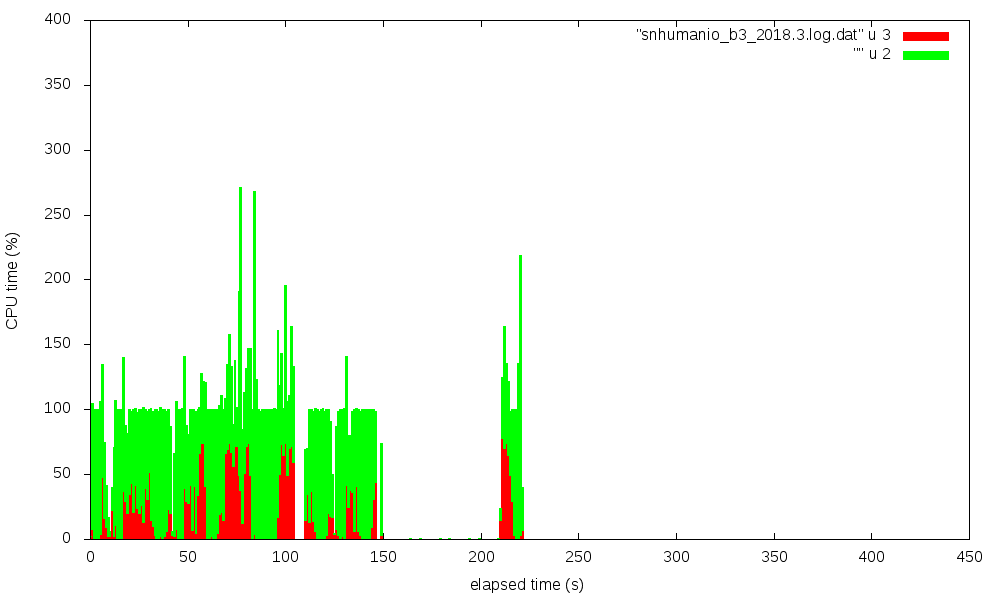
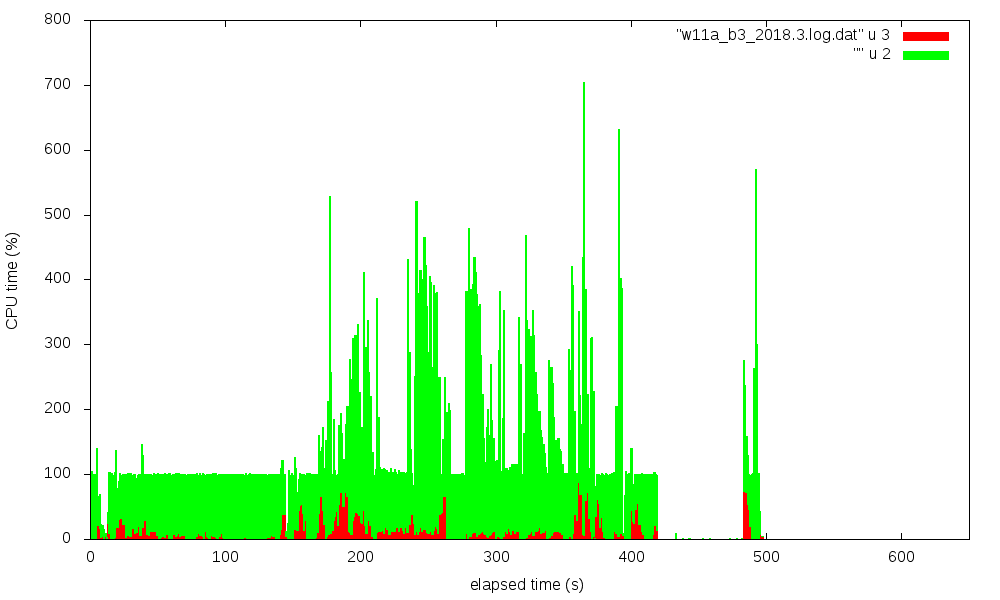
I used pipstat to trace this and tried to visualize this with
gnuplot. Four figures show the CPU utilization (in %) over time,
red is system state time, green is user state time.
Click on figure for full-size display:
| snhumanio_b3 | w11a_b3 | |
|---|---|---|
| 2 0 1 7 . 1 |
|
|
| 2 0 1 8 . 2 |
|
|
The transitions from synth to impl to bitgen phases are nicely visible,
especially for the w11a_b3 case.
It is striking that 2018.2 has extended times with about 75% system time,
while 2017.1 shows only a very moderate system time fraction. The data for the
pictures were taken on sys2, on an otherwise idle system,
back-to-back in one session.
Vivado 2018.3 update -- now a bit better (2019-01-03)
I've retested the cases described on 2018-09-01 with Vivado 2018.3, the measured execution times for a syn+imp+bit build were
                 --  snhumanio --    -----  w11a -----
                    sys1     sys2       sys1      sys2

      2017.1     3m28.5s  2m19.6s    8m00.6s   4m50.9s
      2017.2     3m43.6s     n/a     8m35.9s      n/a
      2018.2     8m55.2s  7m19.3s   13m47.6s  10m01.8s
      2018.3     4m32.2s  3m44.5s   12m01.7s   8m20.2s
Vivado 2018.3 is a bit faster than 2018.2, but still significantly slower
than 2017.1 or 2017.2. I've also repeated the `pipstat` traces. Vivado
2018.3 does no longer show the excessive amount of system time seen
in 2018.2. However, there is still hard to explain the idle time of
several 10 seconds at the end of the bitgen phase. This was also observed
for 2018.2, but not for 2017.1.
| snhumanio_b3 | w11a_b3 | |
|---|---|---|
| 2 0 1 7 . 1 |
|
|
| 2 0 1 8 . 3 |
|
|
2018-09-27: the posting earned within one month 10 Kudos,
made into the HOT!! Kudos classification, and was for
some time the top kudoed post in the whole Xilinx forum. See
screenshot taken on 2018-09-27.
|

|